Understanding Receivables and Aging in Credit Decisions
This guide explains receivables through the lens of credit risk and working-capital management, grounding the discussion in Receivables Investopedia concepts. It clarifies what receivables are, why aging matters, and how investors and operators evaluate collectability objectively, including practical controls and decision conditions. The focus stays on measurable governance rather than speculation.

1) Why Receivables (and Aging) Matter for Credit and Cash Flow
Receivables are the “bridge” between sales and cash. When you manage them well, you stabilize liquidity; when you mismanage them, your operating cycle can unravel—sometimes even while revenues look healthy. In practical terms, this is what Receivables Investopedia frameworks emphasize: receivables are a balance-sheet claim that depends on future payment behavior. That is why aging—how long invoices have been outstanding—often becomes the decisive input for credit limits, collections strategy, and impairment decisions.
At an expert level, the key is to treat receivables not as a static accounting number but as a dynamic risk measure. Each invoice carries its own collection probability, and the portfolio’s total risk emerges from how those probabilities shift over time.
To understand why aging is so powerful, think of receivables as a portfolio of “mini outcomes.” A current invoice might have a 95% chance of paying in full within terms. A 60-day invoice might drop to 70%. A 90+ day invoice might drop dramatically depending on the customer and the dispute context. Those probabilities aren’t fixed forever; they change when customers encounter financial stress, when contracts allow longer settlement, when invoice quality deteriorates, or when operational problems prevent acceptance. Aging effectively provides a time-based signal that payment behavior is trending away from “normal.”
From a credit manager’s standpoint, the most dangerous scenario is not that total receivables rise—growth is common—but that receivables rise faster than the underlying cash conversion process can support. In other words, you want receivables to behave like a predictable reflection of sales and credit policy, not like a surprise funding need.
For cash flow forecasting, receivables aging is often more actionable than revenue forecasts. Revenue tells you what you booked; aging tells you what you’re likely to collect. Even if revenue is projected accurately, poor collections can still create a cash gap. That gap can force short-term borrowing, trigger covenant risk, delay supplier payments, and ultimately harm operations. In high-growth or cyclical industries, these effects can compound quickly.
Finally, aging matters because it influences impairment (expected credit losses), which in turn affects earnings. Under modern accounting approaches, companies generally cannot ignore credit deterioration until it becomes a “known loss event.” Instead, they estimate expected losses earlier. Aging therefore becomes not only a collections tool but also a key input into financial reporting reliability.
2) Receivables: A Neutral Definition Before Any Judgment
“Receivables” generally refers to amounts owed to a business by customers in exchange for goods or services. From an analyst’s perspective, receivables are typically recorded as current assets when settlement is expected within the operating cycle (or within 12 months, under common reporting conventions).
But the accounting label does not guarantee cash will arrive on schedule. Collectability depends on:
- Customer creditworthiness at the time the invoice is issued.
- Contract terms (payment schedules, dispute windows, billing accuracy requirements).
- Collection execution (reminders, escalation processes, dispute management).
- Economic conditions that affect customers’ ability to pay.
That is the conceptual reason a Receivables Investopedia-style discussion inevitably links receivables to credit risk, not merely to bookkeeping.
It can be helpful to add a nuance that professionals often consider: receivables are not all “the same.” Even within the same balance sheet line item, there may be invoices that are effectively secured by strong credit, invoices backed by legal rights and standardized acceptance, invoices in ongoing disputes, invoices tied to retainage or milestone-based payment terms, and invoices subject to chargebacks. Treating all receivables as identical is how companies end up with misleading dashboards and incorrect assumptions.
Another nuance is that “receivables” can include multiple subtypes depending on the company. Many companies have trade accounts receivable from sale of goods or services. Some may also have notes receivable (formal promissory instruments), contract assets (depending on revenue recognition mechanics), or other receivable categories that behave differently. If you mix categories, aging patterns and credit risk signals become less reliable.
Therefore, for accurate credit decisions, professionals typically confirm:
- What exactly is included in the receivables balance (trade AR only vs. broader receivables).
- Which aging date is used (invoice date vs. due date vs. service date).
- Whether credit memos, write-offs, and unapplied cash are treated consistently.
- Whether disputes are embedded in AR or excluded until resolved.
These “data hygiene” points matter because they define what aging is actually measuring. Aging can be very precise when implemented correctly; it can become misleading when implemented inconsistently.
3) Aging Schedules: Turning “Time” into an Actionable Credit Signal
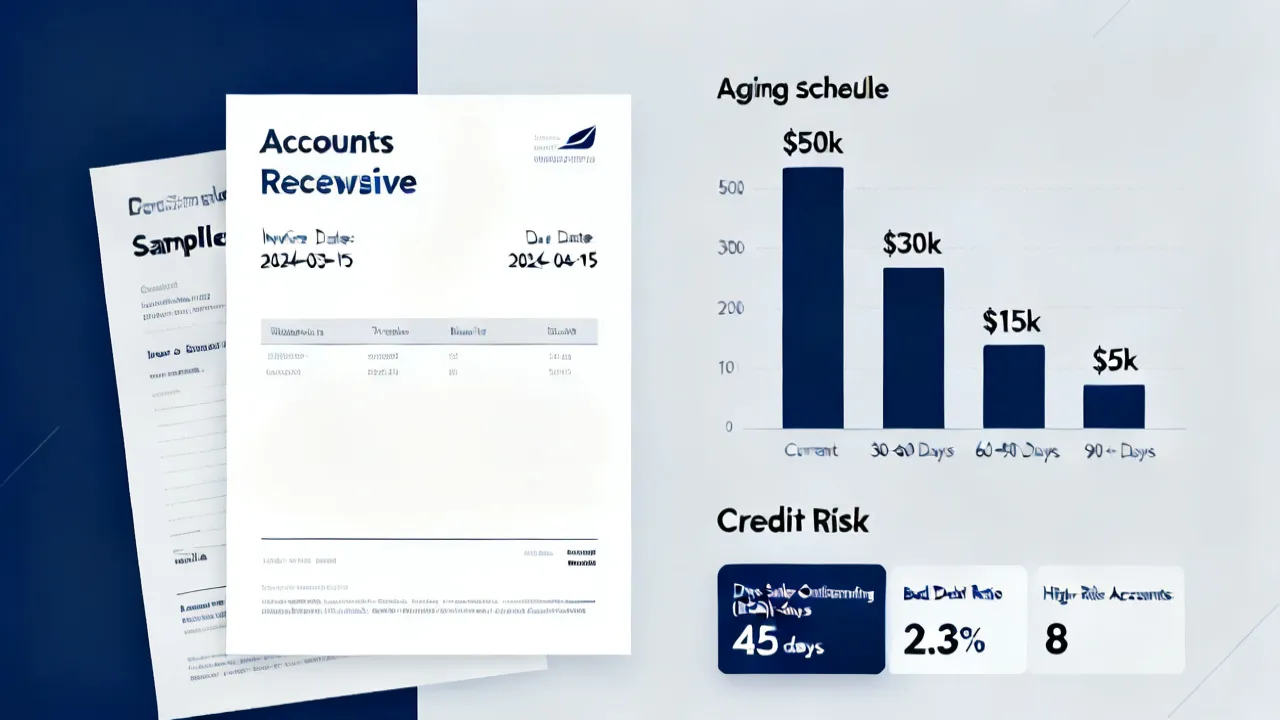
An aging schedule groups outstanding invoices by how long they have been unpaid—commonly into buckets such as “current,” “30 days,” “60 days,” “90 days,” and “90+ days.” While different industries may adapt the buckets, the underlying logic is consistent: the longer an invoice remains unpaid, the higher the probability of late payment, partial payment, or nonpayment.
From an industry expert’s viewpoint, aging is valuable because it connects operational reality to financial consequences. A company may have:
- Healthy revenue but increasing “90+ days” receivables—often signaling credit deterioration, billing disputes, or process gaps.
- Flat revenue but improving aging—often signaling better credit selection or collections discipline.
- Seasonality that temporarily inflates receivables—requiring normalization rather than panic.
The goal is not to treat aging as a standalone metric. Instead, aging should be interpreted alongside customer concentration, historical collection patterns, and credit policy changes.
Professional interpretation usually distinguishes between “age” and “days sales outstanding” (DSO). DSO aggregates timing for the overall receivables base, often based on average receivables and revenue. Aging, by contrast, shows the distribution of invoices across time buckets. Two companies can have the same DSO but very different aging profiles—one may have mostly current invoices with a small set of old disputes; another may have uniformly spread invoices that are late across many customers.
This distribution matters because collections strategies differ. If old invoices are concentrated in a few problem customers, you might prioritize those relationships and legal remedies. If lateness is spread broadly, it may indicate a systemic billing or process issue, such as inaccurate invoices or unclear acceptance criteria.
Additionally, aging should be studied with careful attention to due dates. In some businesses, contract terms include long dispute windows or scheduled payment dates that are not aligned with invoice dates. If you age by invoice date, you may overstate “risk” during early windows. If you age by due date, you may understate “risk” when invoice disputes delay the due date itself. Many mature organizations maintain multiple aging views: one by invoice date for operational understanding and another by due date for credit collection prioritization.
At a deeper level, you can use aging migration as a diagnostic. Rather than asking “how much is in 90+?”, you ask “what proportion migrated from current to 30+ to 60+ over a defined period?” This reveals the pace of deterioration. Slow migration might indicate isolated issues. Fast migration indicates a systemic breakdown or a rapid shift in customer credit posture.
4) How Investors and Credit Analysts Evaluate Collectability
Professional evaluation typically follows a structured logic:
- Quality of receivables: Are they broadly distributed across customers or concentrated in a few counterparties?
- Recency of invoices: Are older invoices rising due to systemic issues, or are they isolated exceptions?
- Dispute rates: Frequent disputes can inflate aging without necessarily implying insolvency.
- Historical loss experience: How often do invoices in each aging bucket convert to write-offs?
- Forward-looking indicators: Credit monitoring outputs can precede payment deterioration.
Under widely used impairment approaches (for example, Expected Credit Loss models in relevant accounting standards), assessments incorporate both historical information and reasonable, supportable forward-looking data—though the exact mechanics depend on the reporting framework.
When investors assess collectability, they often triangulate from multiple angles rather than relying on aging alone. For example:
- Cash flow statements: Are operating cash flows lagging net income?
- Working capital changes: Is AR growth contributing to a negative cash conversion cycle?
- Gross margin trends: Are there hints of billing disputes or contract settlements impacting margins?
- Write-offs and recoveries: Are reserves adequate, and is there evidence of under/over-estimation?
Credit analysts also pay attention to collection timing variability. If a company historically collects quickly but now shows increased volatility—like payments bunching or sudden delays—that suggests changes in customer behavior or internal collections practices.
Another key consideration is barriers to collection. Some receivables are collectible only if disputes are resolved promptly. If acceptance criteria are vague, if customers have multiple stakeholders who must sign off, or if invoices require manual approvals, collection timelines can stretch regardless of customer solvency. Analysts therefore interpret aging in the context of process complexity.
In sophisticated evaluations, analysts compute or estimate metrics tied to aging quality, such as:
- Net AR aging after accounting for credit memos and unapplied cash.
- Dispute-adjusted aging (old invoices segregated by whether they are disputed).
- Exposure at risk by aging bucket and customer segment.
This helps separate “soft risk” (disputed but expected to resolve in favor) from “hard risk” (customer insolvency or repeated nonpayment).
5) Common Causes of Receivables “Stress” (and What to Check First)
When receivables become problematic, the root cause usually falls into a few buckets. A disciplined approach avoids guessing and instead validates hypotheses using observable evidence.
5.1 Credit Policy Drift
If a firm loosens credit terms to win business, receivables may grow faster than cash conversion. Check whether credit approval standards changed, whether credit limits increased, or whether “exceptions” became more frequent.
Credit policy drift can be subtle. It might not show up in a formal policy document; it may appear in operational behavior—sales pushing for faster approvals, finance approving exceptions without consistent documentation, or credit limits raised because of one-off relationships that were profitable in the past. The key is to identify whether approval controls are being bypassed.
Good practice includes comparing:
- The percentage of new customers on “standard” vs. “exception” terms.
- Average credit limits relative to risk rating changes.
- Approval timeframes (faster approvals might correlate with less thorough checks).
5.2 Billing Accuracy and Delivery Confirmation
In many industries, invoices become disputed due to documentation mismatches. Errors in quantities, service dates, purchase order references, or acceptance confirmations can delay payment without reflecting the customer’s underlying financial health.
This is where operational controls matter. A company may have a robust credit policy and strong customer base, yet still experience aging stress because invoices fail to match contract expectations. When invoices do not reflect delivered quantities or proper service periods, customers legitimately withhold payment pending correction.
To check this, you typically analyze dispute drivers and their aging profile. If a large portion of 60–90 day receivables are linked to billing defects, then the “problem” is often invoice quality rather than credit deterioration.
Examples of billing accuracy breakdowns include:
- Using the wrong tax treatment or incorrect billing address.
- Incorrect line items due to pricing schedule updates.
- Missing or outdated purchase order numbers.
- Failure to include required supporting documentation.
5.3 Collections Process Bottlenecks
Even strong customers can miss payments if reminders are inconsistent or escalations are slow. Evaluate whether collection workflows are timely and whether responsibilities are clear.
Collections bottlenecks often arise from manual processes, unclear ownership, and insufficient cadence. For instance, if collections are handled by multiple teams with different escalation triggers, invoices can linger because no one feels fully accountable. Another common issue is when dispute and collections are treated separately—collections keeps chasing cash while disputes remain unresolved, or disputes remain open because there is no clear resolution SLA.
To diagnose collections bottlenecks, mature companies audit key cycle times such as:
- Time from invoice due date to first outreach.
- Time from dispute initiation to dispute triage.
- Time from dispute resolution to credit memo issuance or revised invoice.
- Time from escalation to legal action decision (when applicable).
Shortening these cycle times can reduce aging even if customer solvency is unchanged.
5.4 Customer Concentration
A receivables portfolio dominated by a small number of large customers can be more volatile than the total balance suggests. Analysts often review the top-customer exposure and compare it with the aging profile.
Concentration risk is not only about whether customers will pay; it’s also about operational knock-on effects. When a few large customers delay payments, a company’s liquidity and credit facility usage can change immediately. Moreover, customers at scale may have different procurement cycles, invoice processing systems, and internal approval steps. Those steps can affect payment timing regardless of willingness to pay.
To manage concentration, organizations typically combine:
- Top-customer exposure limits.
- Customer-specific credit review cadence.
- Contractual payment protections (where possible).
- Insurance or factoring strategies for specific segments.
5.5 Economic or Sector Downturn
Macroeconomic shifts may not appear immediately in financial statements; they can show up first in customer payment behavior. This is where forward-looking signals and monitoring matter.
Payment behavior often changes before customers show formal insolvency. Customers may begin to stretch payment terms, delay payments for operational reasons, or increase invoice disputes as a negotiation strategy. Therefore, credit monitoring should focus on both “hard” signals (bankruptcies, rating downgrades) and “soft” signals (slower payment patterns, increased dispute frequency, changes in purchasing volumes).
In downturns, a mature receivables strategy also includes scenario planning: what if collections slow by 10–20 days across a segment? How much liquidity buffer is needed? What is the impact on covenant metrics?
6) Working Capital Impact: The Cash Conversion Reality
Receivables sit at the center of the cash conversion cycle. If days sales outstanding (DSO) rises, cash tied up in receivables increases, which can force the business to rely on external financing or to defer growth investments.
However, analysts must distinguish between:
- Temporary timing increases (seasonality, contract ramp-up).
- Structural deterioration (policy loosening, process breakdown, persistent disputes).
In professional practice, this differentiation is usually done via trend analysis by cohort (invoice month), customer segment, and product/service category—not by looking at a single aggregate balance.
One reason aggregate analysis can be misleading is that different cohorts can offset each other. Suppose a company has rising AR in older buckets but also has strong collections in newer invoices. In total receivables, the net might not look alarming. Yet cash flow might still be constrained because the oldest cohorts are the ones least likely to convert quickly. Aging distribution therefore deserves priority attention.
In addition, working capital management requires aligning internal incentives. If sales teams are measured purely on revenue and not on cash conversion, they may push for deals that increase receivables risk. If operations teams are measured on delivery or backlog metrics without accountability for invoicing readiness, invoices may be issued late or with errors, increasing disputes and slowing cash collection.
Many organizations implement cross-functional KPIs such as:
- Invoice error rate (billing defect frequency).
- Dispute cycle time.
- DSO by segment and by customer tier.
- Cash collected vs. invoices issued (to detect collection drift).
These measures tie operational performance to cash outcomes and help prevent “surprises” that only appear in finance reports.
7) Impairment and Reserves: Where Accounting Meets Risk Management
Many reporting regimes require recognizing expected credit losses rather than waiting for a “loss event” to occur. The practical implication for receivables management is that businesses must estimate collectability and track whether those estimates remain aligned with observed payment patterns.
From an expert’s standpoint, reserve adequacy is not a one-time exercise. It should be continuously challenged as new information arrives—especially after notable customer events, changes in payment terms, or material shifts in industry conditions.
Importantly, the evaluation should be evidence-based. For formal methodologies and terminology, practitioners often refer to authoritative sources such as:
- IFRS 9 (Expected Credit Loss concepts under certain accounting contexts), and
- ASC 326 (CECL under U.S. GAAP).
These frameworks do not tell you “the right number” to pick, but they define the expectation that credit losses should be recognized using reasonable and supportable information.
At a practical level, reserve models often use aging-based probability of default or loss given default estimates. But aging alone rarely captures all risk. A reserve model may incorporate additional factors such as:
- Customer risk ratings (internal and/or external scores).
- Historical loss experience by customer segment or industry.
- Macroeconomic scenario weightings.
- Forward-looking adjustments when credit conditions change.
- Collateral or contractual protections (where relevant).
Reserve governance also matters. Models can become outdated when business mix changes. For example, if a company shifts toward smaller customers, older cohorts might have different default behavior than the past. If the company begins offering different payment terms, historical loss rates might not apply cleanly. Therefore, reserve models should be validated periodically and updated as data evolves.
Another important operational consideration is the relationship between reserves and collections strategy. Reserves are accounting estimates, but collections actions influence future outcomes. If a company invests in faster dispute resolution and clearer invoicing, actual loss rates may decrease. Conversely, if collections are weakened, observed write-offs may exceed reserve assumptions. This feedback loop—model to collections to observed outcomes—is a hallmark of mature credit risk management.
8) Industry Perspective: Why “Receivables Investopedia” Themes Still Matter
Even though educational resources differ in emphasis, the recurring theme in Receivables Investopedia style explanations is that receivables represent a claim contingent on future cash inflows. That contingency drives the analytical focus on aging, collectability, credit policy, and risk measurement.
In other words, the “investor lens” and the “operator lens” align. Operators want cash predictability. Investors and lenders want assurance that the balance sheet reflects realistic expectations of payment.
In many industries, receivables also tie into operational strategy. For example:
- Manufacturing may face disputes tied to acceptance testing, delivery documentation, and contract specifications.
- Construction often deals with milestone payments, retainage, and long verification cycles that distort traditional aging interpretations.
- SaaS and subscriptions may have billing system dependencies and contract churn that influence payment timing and collections quality.
- Healthcare may be affected by reimbursement delays and regulatory claim processing, changing the meaning of “overdue.”
Because each industry has different reasons for delayed payment, the interpretive framework must be adapted. Yet the core principle remains: aging is a risk signal, and the receivables balance is a probabilistic outcome rather than a certainty.
9) Practical Controls to Improve Receivables Quality
Improving receivables is rarely achieved by a single action. It is usually the outcome of process design, governance, and monitoring. Key controls commonly include:
9.1 Invoice Quality Gates
- Standardized invoicing templates with required fields.
- Pre-billing checks comparing order, delivery/acceptance, and contract terms.
- Automated exception alerts when discrepancies occur.
Invoice quality gates are often the highest ROI controls because invoice errors create both customer dissatisfaction and internal rework. When invoices are wrong, customers can refuse payment legitimately or delay processing until corrections are issued. This increases aging and can also increase reserves because collectability assumptions become less stable.
To strengthen invoice quality gates, organizations can introduce:
- One-source-of-truth billing data so that order, inventory, and service records reconcile.
- Automated validations for quantities, prices, dates, and reference numbers.
- Customer-specific formatting rules to match each customer’s AP requirements.
These steps reduce disputes and improve first-pass invoice acceptance rates.
9.2 Credit Review and Limit Management
- Periodic creditworthiness reviews based on monitoring outputs.
- Clear credit limit escalation procedures.
- Documented approval trails for exceptions.
Limit management improves receivables quality by aligning sales growth with risk capacity. It prevents excessive exposure to weak customers and forces discipline when exceptions are necessary. But for limit management to work, credit reviews must be timely and consistent.
Some organizations also implement:
- Customer risk tiering with different credit terms by tier.
- Re-rating triggers based on behavioral indicators (payment delays, dispute spikes) and external signals (rating changes).
- Term adjustments for customers exhibiting early warning trends.
This ensures that credit risk changes are reflected in commercial terms before aging becomes severe.
9.3 Collections Cadence and Dispute Workflow
- Structured reminder schedules by aging bucket.
- Defined dispute acceptance criteria and resolution SLAs.
- Alignment between billing, customer success, and finance.
Collections cadence determines how quickly you can convert “late” into “resolving” and “resolving” into “paid.” Structured outreach—tailored to aging buckets—helps ensure invoices do not sit unattended. But cadence alone is not enough; dispute workflow quality often determines whether collections is efficient or fragmented.
Dispute workflow improvements may include:
- Clear dispute categorization (billing error vs. service deficiency vs. contract disagreement).
- Customer communication templates to reduce back-and-forth.
- Internal task assignment with accountability and deadlines.
- Rules for what happens when disputes are unsubstantiated or time-barred.
When disputes are managed correctly, aging can improve without having to tighten credit terms aggressively.
9.4 Concentration Monitoring
- Top-customer aging dashboards.
- Early-warning triggers when a customer’s aging migrates to older buckets.
Concentration monitoring helps avoid “single point of failure” liquidity risk. A company might have acceptable overall aging but still be exposed to a few customers whose delayed payments can strain liquidity. Dashboards should therefore show both total exposure and aging distribution by top customer and by tier.
Early-warning triggers can include:
- An increasing share of exposure in 60+ and 90+ buckets.
- A rising dispute rate for a specific customer.
- Changes in payment patterns such as partial payments or short payments increasing.
When triggers fire, the company can implement targeted actions—such as adjusting payment terms, increasing credit review cadence, or prioritizing dispute resolution.
9.5 Reserve Governance
- Model review cadence and validation using observed outcomes.
- Audit-ready documentation of assumptions and support.
Reserve governance ensures that impairment estimates remain credible and aligned with the current receivables environment. It also supports auditability—an essential requirement in many regulated or large-company contexts.
Reserve governance best practices often include:
- Periodic back-testing of reserve adequacy (comparing expected vs. realized losses).
- Documented rationale for forward-looking adjustments.
- Change control when model assumptions or data sources are updated.
- Cross-functional review between credit, finance, and accounting teams.
When reserves are governed well, you reduce the risk of sudden earnings shocks caused by underestimation of credit losses.
10) Comparison Table, Source, Step-by-Step Guide, and Conditions/Requirements
The following supplement is designed to help practitioners translate the receivables concepts into decisions. It focuses on comparisons, evidence sources, and implementation conditions.
| Decision Area | Comparison: What to Use | Typical Source of Evidence | Key Conditions / Requirements |
|---|---|---|---|
| Aging for action | Use aging bucket trends (e.g., migration to older buckets) versus relying only on total receivables balance | AR subledger reports, invoice-level history, aging roll-forwards | Consistent aging logic; invoice dates and terms standardized |
| Reserve / impairment estimation | Use expected credit loss concepts rather than waiting for confirmed nonpayment | Authoritative accounting standards and internal loss history | Assumptions documented; supportable forward-looking inputs; model validation |
| Credit limit setting | Compare policy-based limits (risk rating) versus ad hoc approvals | Credit bureau monitoring, internal payment behavior, contract history | Formal approvals; periodic re-rating; clear treatment of disputes |
| Collections prioritization | Use “age + exposure + dispute status” scoring rather than “largest balance first” only | Collection system status logs, dispute tracking, invoice ownership data | Single source of truth for dispute status; consistent escalation thresholds |
11) Step-by-Step Guide: From Receivables Data to Credit Decisions
Below is a practical approach that an experienced credit and finance professional might follow when interpreting receivables and aging. It is intentionally process-oriented to encourage repeatable outcomes.
- Reconcile the AR subledger to the general ledger to ensure completeness and accuracy.
- Segment receivables by customer, region (if applicable), product/service, and invoice age buckets.
- Identify migration: compare current aging distribution against prior periods and highlight shifts into older buckets.
- Classify exceptions (disputes, credits, billing holds) so aging reflects “true collection risk,” not process artifacts.
- Review customer credit posture using both monitoring outputs and observed payment behavior.
- Assess concentration by quantifying exposure to top customers and top aging buckets.
- Update reserves/impairment inputs using reasonable and supportable data consistent with your reporting framework.
- Adjust credit terms and limits based on validated evidence—ensuring approvals follow policy for any exceptions.
- Implement collections actions with a cadence tied to aging and dispute resolution SLAs.
- Track outcomes by cohort (invoice month) to validate whether actions improved cash conversion and reduced loss rates.
To make this guide even more operational, it can help to treat each step as a decision checkpoint with specific “outputs.” For example:
- After reconciliation: confirm that AR totals match and identify any reconciling items (unapplied cash, credits, timing differences).
- After segmentation: define the highest risk buckets and the top customers driving migration.
- After exception classification: produce a dispute-adjusted aging view and estimate expected resolutions vs. likely nonpayment.
- After credit posture review: determine whether to re-rate customers, adjust limits, or modify terms.
- After reserve updates: document rationale and compare expected losses to observed historical outcomes.
- After collections actions: record actions taken, next escalation dates, and expected resolution milestones.
This prevents the analysis from being “one-time” and ensures that insights translate into measurable actions.
12) FAQs
What exactly are “receivables” in financial reporting?
Receivables are amounts owed to a business by customers for goods or services already delivered or performed. They are recorded as assets because the business expects to receive cash (or other consideration), but the timing and collectability depend on credit risk and contract terms.
How does an aging schedule differ from total receivables?
Total receivables can rise for many reasons, including normal seasonal volume. An aging schedule shows how long receivables have remained unpaid. That time dimension is often more directly linked to collectability risk and the effectiveness of credit and collections processes.
Why is collectability sometimes questioned even when sales increase?
Sales growth can occur alongside tighter credit terms, higher dispute rates, or weakened customer payment behavior. If those factors are present, receivables may increase faster than expected cash conversion, and impairment risk may rise even if revenue appears strong.
How do businesses estimate expected credit losses?
Estimation generally uses a combination of historical loss experience and reasonable, supportable forward-looking information. The exact method depends on the applicable accounting standard (for example, IFRS 9 or U.S. CECL). Governance, documentation, and validation against actual outcomes are essential.
What are the very common operational drivers of worsening receivables aging?
Common drivers include invoice inaccuracies, slow dispute resolution, credit policy drift, weak collections cadence, and customer concentration shocks. Many improvements can be achieved by strengthening billing controls, dispute workflows, and credit monitoring rather than by changing accounting approaches alone.
Are receivables always a “safe” asset?
No. Receivables represent future payment expectations. Their risk profile depends on customer creditworthiness, payment history, the structure of contracts, and how effectively the firm manages disputes and collections.
How should a company respond if older receivables rise?
A response typically combines diagnosis and action: reconcile and segment the data, separate disputes from genuine nonpayment risk, review affected customer credit posture, adjust credit limits/terms as needed, strengthen collections for those buckets, and update impairment estimates using supportable information.
13) Reliable References and What They Support
For readers seeking authoritative grounding on impairment and expected credit loss principles, consult the following standard-setter documents:
- IFRS 9 Financial Instruments (Expected Credit Loss model concepts)
- ASC 326 (U.S. GAAP Current Expected Credit Loss model)
For practical interpretive context on credit risk and receivables management, educational materials such as widely used finance references (including concepts commonly summarized in resources like Receivables Investopedia) can help connect definitions to real-world analysis—but the accounting standard remains the authoritative source for impairment mechanics.
14) Conclusion: Treat Receivables as a Managed Portfolio, Not a Static Number
Receivables management is ultimately a discipline of probabilities. Aging schedules convert time into risk insight; credit policies define how risk is accepted; collections workflows control behavior; and impairment estimates translate expected outcomes into financial reporting.
When businesses treat receivables as a living portfolio—monitored, segmented, and governed—cash conversion becomes more predictable and financial statements better reflect underlying credit reality. That is the professional takeaway that remains consistent with Receivables Investopedia-style explanations: the balance sheet is only as dependable as the processes and evidence behind it.
In practice, the best receivables programs create a feedback loop between day-to-day execution and strategic risk management. Each improvement in invoice accuracy reduces disputes; faster disputes resolution improves cash timing; more disciplined credit limit management reduces exposure growth; and reserve governance ensures that accounting reflects both observed performance and reasonable forward-looking expectations. Over time, this system reduces surprises—both in cash flow and in earnings—because the company continuously measures what it can collect, why it might not collect, and what it is doing to influence those outcomes.
Ultimately, the value of receivables and aging is not merely analytical. It is operational and financial. Receivables are where credit risk becomes real cash outcomes. Aging is where risk becomes visible early enough to act. And when those insights are managed with discipline, a business can support sustainable growth without letting liquidity erode beneath the surface.